
Debug & Diagnostics
Understand every request. Profile MongoDB and Redis operations, inspect Twig rendering, track exceptions, and debug AJAX requests individually — directly in APPNETOS.
Debug mode can expose exceptions, request parameters, session information and other sensitive runtime details. Do not leave it enabled in production.
If temporary production debugging is unavoidable, disable debug mode immediately afterward
and remove the copied DebugBar assets from ./public/src/appnetos-debugbar. Also review any
persisted debug data and restrict access while debugging.
How debugging works
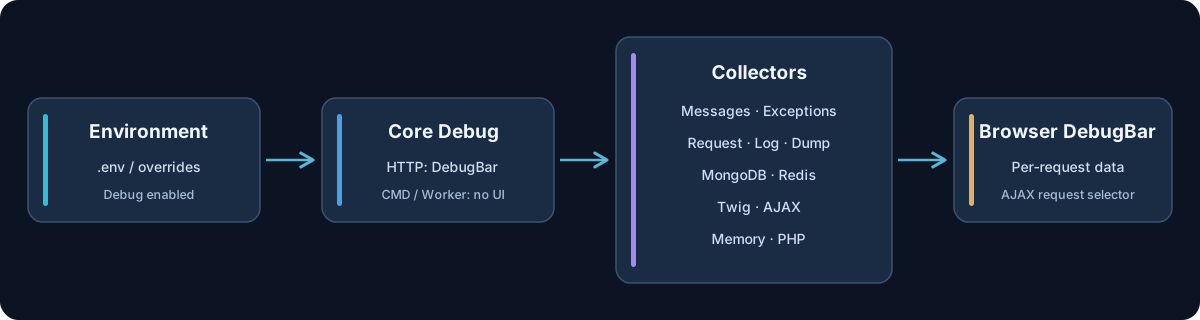
APPNETOS resolves the debug state from the active environment configuration and its overrides. Debugging
is
enabled for the corresponding runtime through its .env configuration; it is not a feature
that
application code should toggle during an ordinary request.
When enabled in an HTTP runtime, the Core initializes its DebugBar, registers collectors and makes exceptions visible in the frontend. For command and worker processes, the debug state is retained without initializing the graphical DebugBar.
Browser console warning
The bundled appnetos.js reads APPNETOS_DEBUG_MODE during page initialization.
When
active, it prints a prominent warning and additional runtime information such as session identifier,
session
timeout, current URL, base URL and AJAX token. Never expose this information to untrusted users.
DebugBar panels
| Panel | Information |
|---|---|
| Messages | Debug warnings, Redis/MongoDB connection status and cumulative MongoDB/Redis execution times. |
| Request | Request data, including GET, POST and COOKIE parameters. |
| Exceptions | Exceptions collected during the request. |
| Log | Log entries written during the current request. |
| Dump | Values dumped from PHP and Twig. |
| MongoDB | Individual database operations with execution times. |
| Redis | Individual Redis commands and execution times, including profiled pipelines. |
| AJAX | Parameters of an AJAX request when applicable. |
| Twig | Rendered templates and profiling information, including rendering time and memory usage. |
| Memory | Peak PHP memory usage. |
| PHP | PHP version and runtime information. |
Debugging AJAX requests
Every AJAX request can be inspected as its own DebugBar entry instead of being merged into the initial
page
request. The APPNETOS JavaScript client reads the phpdebugbar-id response header, retrieves
the
corresponding debug dataset through the DebugBar open handler and adds it to the existing toolbar.
Developers can select each request and inspect its collectors independently.
// appnetos.js: AJAX debug integration (simplified)
const id = response.headers.get('phpdebugbar-id');
// The DebugBar open handler loads the matching request dataset.
DebugBar assets and storage
When the DebugBar is initialized for the first time and the target directory does not exist, APPNETOS
copies
the vendor DebugBar frontend resources to ./public/src/appnetos-debugbar. If the directory
already exists, the copy step is skipped. The Core also uses file-backed DebugBar storage scoped to the
active application and runtime context, allowing AJAX request datasets to be loaded separately.
Important: Switching debug mode off does not automatically remove previously copied public assets. Remove them after temporary production diagnostics.
Public API Reference
Core\Debug
Class & Registry
Class:
Core\Debug
Extends:
Core\Debug\Base
use Core\debug;
use Core\Registry;

$debug = Registry::get(Debug::class);| Method | Description |
|---|---|
init() |
Initialize debug state and HTTP DebugBar. |
addMessage(message, type) |
Append an informational, warning or error message. |
addLog(message, type) |
Add a request log entry. |
addDump(message) |
Send a value to the Dump collector. |
addMongoDb(message, type) |
Record MongoDB profiling information. |
addRedis(message, type) |
Record Redis profiling information. |
addAjax(message, type) |
Record AJAX request details. |
addException(exception) |
Collect an exception. |
addMongoDbExecutionTime(milliseconds) |
Accumulate MongoDB execution time. |
addRedisExecutionTime(milliseconds) |
Accumulate Redis execution time. |
handleOpenHandlerRequest() |
Process a stored DebugBar dataset request. |
sendDebugBarData() |
Send debug data in HTTP response headers. |
getDebugBarHead() |
Render DebugBar head resources. |
getDebugBarBody() |
Render DebugBar body markup. |
getDebug() |
Read debug state. |
getDebugBarEnabled() |
Check graphical DebugBar availability. |
getInitialized() |
Check initialization state. |
Recommended workflow
- Enable debug mode in the appropriate environment configuration or override.
- Reproduce the problem in the matching application and context.
- Inspect Messages, Exceptions, Request, Log and Dump.
- Use MongoDB, Redis and Twig panels to locate slow operations.
- For AJAX interactions, select the corresponding individual request in the DebugBar.
- Disable debugging after investigation; on production, remove
./public/src/appnetos-debugbarand review stored debug data.